Overview
You can tally and check the number of issues stored by Lightning Review for each field with the pivot analysis tool. Two or more review files can be specified for analyzing. Here is described what to and how to analyze data with the pivot analysis tool.
Pivot Analysis Tool
The Pivot Analysis Tool provides analyzing a batch of review files and showing the number of issues with customizing target fields.

Launching Tool
You should launch the tool by either of the following ways.
- Launching from Menu
Select [Tool] menu - [Pivot Analysis Tool].
This way sets the already opened review file as the target review file. - Launching from Start Menu
Select the start menu – [Pivot Analysis Tool].
Setting Target Review File(s)
It is required to set review file(s) to be analyzed.
- For analyzing a single review file, you should drag the target review file and drop it on [Report] pane in the Pivot Analysis Tool].
- For analyzing a batch of review files, you should store the target review files in a folder and drag & drop it.
Setting Fields for Analyzing
You should set fields for analyzing.
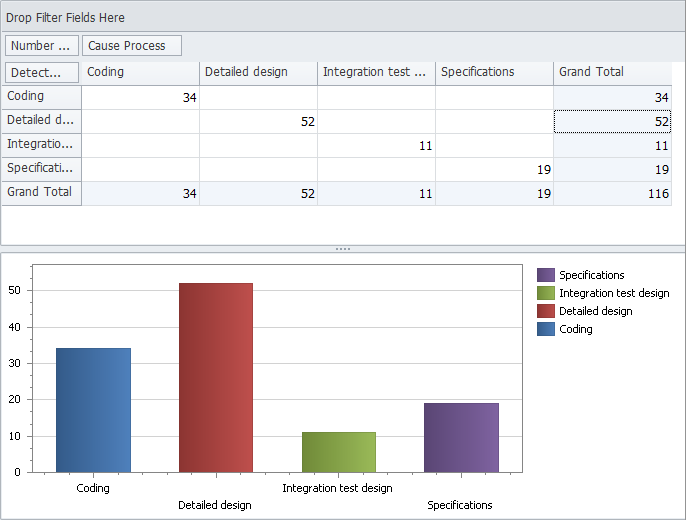
- The number of issues tallied by “Cause Process” and “Detected Process” is displayed in the initial state. Click [Field List] icon to add fields for tallying.
- Drag a field from the displayed [Field List] dialog box and drop it on the pivot grid to add it.
Removing Fields for Analyzing
Drag a field on the grid and drop it on the Field List to remove it.
Showing Graph
You can display the result as a graph by clicking [Show Graph] icon on the menu.
Changing Order of Data
If the outputted data is not in the order you like, you can change the order of data.
- Select [File] menu - [Set Field Order] to show [Order of Field Values] dialog box.
- Select a field in [Field] and change the order of items in [Sort].The items are separated by a new line. Changed order will be applied to the all reports.
Copying Tallied Result
You can copy the tallied result on the pivot grid and paste it to Excel or other applications to use it as a report.
Click [Copy Data] icon on the menu.
* You can copy the data also by selecting [Copy Data] in the context menu on the pivot grid.
Copying Graph
You can copy the graph on the pivot grid and paste it to Excel or other applications to use it as a report.
Click [Copy Graph] icon on the menu.
* You can copy the graph also by selecting [Copy Graph] in the context menu of the graph.
Importing
You can share analyzed date in your group with the import and the export functions. Multiple reports from the same review file with different analyzing conditions can be used with those functions as well.
Select the target report on the [Home] pane and click [Import] icon on the menu to import the report.
* You can import it by selecting [Import] in the context menu on the [Report] pane as well.
Exporting
Click [Export] icon on the menu.
* You can export also export it by selecting [Export] in the context menu on the [Home] pane.
Opening Review File from Tallied Result
You can open the target review file from the tallied result.
- Right-click on the data area of the grid and select [Open Review File] in the context menu.
- The path of the review file including the target issue of the data is displayed. Select the target review file to open it.